 A guide to data loggers including explanations, applications and product selection guide for recording measurement data.
The primary function of a data logger is to create a record of measurements over a period of time at preset intervals.
Datalogging is used to record measurement in many areas of research and industry such as material performance testing, environmental monitoring, quality auditing, scientific experimentation and design proofing.
The main advantage of recording measurements using a data recorder is that it eliminates the errors and time spent writing down or typing in measurement results.
Products
Choose a data logger from the list below to view product specification details and request a price quotation.
 Pressure Data loggers
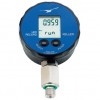 Vacuum, Suction Pressure Data Loggers, Recorders
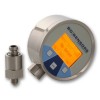 Data Logging Pressure Gauges
 Pressure Sensors for Data Logging with a Computer
 Intrinsically Safe Pressure Data Loggers
 Hydraulic Testing Pressure Data Loggers
Select a digital pressure gauge for your application
Data logger instrumentation for recording measurements and storing results to internal memory or external device such as a personal computer or a USB storage device. The recorded results can be examined by the accompanying software and printed or exported to a spreadsheet or alternative data file.
Pressure Gauges with Integral Data Logger
 Digital pressure gauges combined with a programmable data logger for recording pneumatic or hydraulic pressures at set time periods. Designed to be remotely installed on a process pipe or vessel for monitoring process performance or testing for leaks. Field portable pressure indicators that have the optional capability to store pressure data for recalling on the display screen or transferring to a computer at a later time. Each data point is time and date stamped for compliance with quality audit trail procedures.
Pressure ranges
- 10…300 mbar (dp, g)
- 0.3…3 bar (g, abs)
- 3…1,000 bar (g, abs)
- 1,000…2,200 bar (g)
Datalogger with Universal Sensor Inputs
Multifunctional data recording device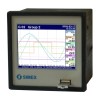 for accepting electrical signals from a wide range of sensor types such pressure, temperature, position, load, humidity and flow.
Pressure Sensors for Data Logging with a Computer
 Digital pressure sensors for connecting to a desktop or laptop computer and logging air and liquid pressures at preset intervals. Connect to a PC serial bus interface via USB or RS232 connections and install the supplied data logging software to add pressure logging functionality to your computer.
- Low pressure
- High pressure
- Differential pressure (low range, dry/dry)
- Differential pressure (mid range, wet/wet)
- Differential pressure (high range, wet/wet)
- Flush diaphragm
- High temperature media
Intrinsically Safe Pressure Loggers
 Intrinsically safe (IS) pressure data loggers which can be used in potentially explosive environments such as oil refineries, offshore oil platforms and natural gas distribution.
Pressure ranges
- 10…300 mbar (g)
- 0.3…3 bar (g, abs)
- 3…1,000 bar (g, abs)
- 1,000…2,500 bar (g)
Atmospheric Pressure Data Logger
Barometric pressure data loggers for recording trends in atmospheric pressure for weather monitoring or for synchronising with other data such as non-vented water level readings. Find logging instrumentation for recording actual local atmospheric pressure or sea level adjusted atmospheric pressure for weather reporting.
Pressure Gauge with PC Data Logging Interface
Digital pressure gauges with RS232 or USB link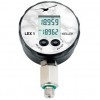 for real-time transfer of pressure readings to a desktop or notebook computer. These instruments provide local indication of the process or test pressure whilst uploading measurement data to a PC at the same time.
Submersible Pressure Data Logger
Pressure logger with watertight connections for submerging into wells, rivers and reservoirs on the end of a steel wire or a vented data communications cable. These loggers can be left in remote locations without any power or data-coms link to record hydrostatic level at predefined intervals.
Data Logging Components
A data logging system comprises of the following basic components. Some of these components will be combined together into one instrument depending on the manufacturer and application requirements.
Sensor
A device for converting a physical parameter such as pressure, liquid level/depth, temperature, flow, force/load, humidity, vibration/acceleration, position/movement/speed, chemical composition, etc…
A sensor can be sourced separately as part of an logging instrumentation package or as an integrated component of a data logger. The former approach provides limitless flexibility in the number and type of sensors that can be used as long as you are prepared to ensure they are compatible with the equipment you are connecting.
It is fairly common for a sensor to include partial or complete signal conditioning and some devices also the analogue to digital conversion.
Signal Conditioning
This component will accept the raw input signal from the sensor which and then process it to provide a normalised output signal which can be understood by more generic instrumentation with a common input / output (I/O) architecture.
The process of signal conditioning involves:
- Rationalisation of each sensor so that multiple sensors all have a similar output characteristic.
- Compensation to reduce errors introduced by changes in temperature, pressure, humidity or other environment or process related variable.
- Transforming the signal into one which is more widely compatible with
other instrumentation.
The signal conditioning maybe incorporated into a separate instrument or as an integrated part of the sensor or data logger. In some cases at maybe necessary to stage the signal conditioning across more than one instrument especially with more exotic sensors where transformation of the signal is more complex.
Analogue to Digital Conversion
In order to store the measurement results into a data bank they must first be converted from a analogue voltage signal into a digital value.
This part of the data logging system is usually incorporated with the data memory storage device, but in some circumstance particularly where high precision is required it will be included inside the sensor.
Data Memory
The size of data storage varies significantly across manufacturers and product type, it is normally specified as a number of Kilobytes (kB), Megabytes (MB) or Datapoints (dp).
The way measurement readings are stored is controlled by the logging routine which is downloaded via the logging application software installed on a PC to the logger.
If the memory is filled during logging, the memory will either stop recording or start to overwrite data previously recorded. The application software may provide the option for you to choose what action to take when the memory capacity is exceeded.
The data memory is usually combined together with a signal conditioning to make a general purpose data logger which can accept analogue inputs from a range of sensor types. For more dedicated use it can also be combined with a sensor and battery power supply which provides a convenient all in one instrument.
Power Source
The power supply is provided by one of the following methods:
- External DC power via AC/DC mains adaptor or a Power Supply Unit (PSU)
- Battery – Alkaline, Lithium or NiCd rechargeable
- Solar Power/Battery combination
- Computer Power via the USB connection
Before commencing to log data it is essential to make sure there is sufficient power to last the duration of the logging run.
Digital Communications
The main purpose of a digital interface is for downloading instructions to the data logger from the computer and uploading stored data from the datalogger to the computer.
When the computer is being used as the data logging platform the digital connection is used to stream live readings.
A few software protocols are used to communicate between a computer and the data logger which include:
- Modbus Serial Communications
- SDI-12 – Serial Data Interface at a 1200 baud rate
- CANbus – Controller Area Network
The communications hardware / system that is used to transmit and receive the logged data includes:
- Universal Serial Bus Interface (USB)
- RS232
- RS485
- Ethernet Local Area Network (LAN)
- WiFi / WLAN – Wireless Local Area Network IEEE 802.11
- GSM – Global System for Mobile Communications
- GPRS – General Packet Radio Service
Computer Hardware
Primarily this is used to run the data logger application software and provide a user interface for setting up the logger and analysing the test results.
Nearly all application software is compatible with Windows based PC computers but there are some packages which are compatible for Apple Mac computers and mobile device operation systems such as Windows Mobile.
Logging Software
A proprietary software package provided with a data logger by the manufacturer. Unless the data logger comes with its own visual display and user interface it is impossible to use it without compatible application software.
The manufacturer will either provide the software with the product in the form of a CD / DVD or as downloadable file via their website on the Internet.
Driver software should also be included to enable computer to communicate with the logger via the chosen digital interface.
Using Data-Loggers
Collecting Data
If you are only interested in recording one parameter at one location, then a integrated sensor and logger is the best and most cost effective solution. It is possible to either connect a gauge or sensor to a PC and log data continuously via PC logging software which is normally sold with the logging equipment.
For multiple parameters and locations the most cost effective approach is to use a multichannel data logger which has universal inputs to accept a wide range of sensor types. These devices normally require external power and in the case of data acquisition cards can be slotted into an instrumentation rack or connected via a cable to standardised digital bus interface which provides power and
upload/download capability.
If the data is not continuously streamed directly to a PC it will need to be buffered or stored in some internal memory storage. The data can be transferred at a later time to a computer for analysis via a physical digital interface such as RS485, RS232 or USB. Some dataloggers are provided with standardised protocol such a Modbus or SDI12 so that the user can utilise there own software to upload the
logged data.
Some data logger manufacturers offer the option to transmit the data via telemetry across a phone line or a mobile phone network, this is essential for remote installations where the data must be collected several times a day.
Conserving Battery Life
If you are using a sensor connected directly to a universal logger, the most energy conserving type of output signal is a high impedance strain gauge bridge which excludes any power consuming amplifiers used in higher output sensors.
For loggers which have an integrated sensor, the battery power can be conserved by optimizing the number of recorded data points over the logging period. The minimum number of data points you need will vary depending on the characteristics and trends you are interested in, but if you always try to make the interval as long as possible it will help cut down on the instruments workload extending the battery life.
If it is possible to utilise a sleep mode between readings this willalso have a significant impact on battery consumption, particularly if there are long intervals between readings.
Managing Data Storage Memory Capacity
Most manufacturer’s will indicate an estimate of the maximum number of data points that can be stored in the memory. In reality this number will vary depending on the number of bytes that is occupied by each data point, since the smaller the value the less memory space it will take up. Additional information such as time, date or temperature readings will also use up extra memory capacity and it will be
difficult to predict the memory usage of these additional parameters. Therefore the manufacturer’s indicated data point capacity should be treated as guide and a reasonable margin of error should be allowed where loss of data is a critical concern.
As is the case when trying to conserve battery life, the time gap between collecting a reading should be as long as possible to reduce the number of stored readings.
Logging Time Interval
This will depend on how dynamic the measurements are likely to be and what kind of event you wish to detect.
If you are looking for very high frequency surges, you will need to set the time interval between data capture to a very short period of time.
Some dataloggers provide an event trigger, so that if a measurement parameter changes by a certain amount within a specified time period it will log at an increased rate. This feature allows you to conserve battery life by recording at a more conservative level for most of the time.
For applications which require trending data only, the interval time can be set for a relatively long period. Some experimentation will be required in order to determine the optimal time interval to produce an adequate plot of data.
Analysing Recorded Data
Once the data has been collected and uploaded to a PC via the manufacturer’s software it should now be possible to examine the data.
As a minimum the software should provide the ability to display each data point in a table of results in chronological order with a time and date tag against each individual recorded measurement.
It should also be possible to print out a formatted test results sheet directly from the manufacturer’s software.
To enhance the presentation of the data and make it easier to spot trends there should also be the option to view a graph of the data plot. Depending on the complexity of the software it maybe possible to manipulate the plotted chart to expand particular time periods to explore unusual characteristics in more detail.
One of the most useful features of any datalogging software is the ability to export a file of data in a universal format such as .xls, .csv or .dat so that it can be imported into application software such as Microsoft Excel or Access and then analysed and processed to a user’s custom requirements.
Questions & Answers on Data-Logging
Mains water pressure logging
I’m looking for a digital water pressure recorder that can help with problems with mains water pressure on a water softener which we think is varying. I like to install a logger and leave it for a couple of weeks, and then retrieve and download the results.
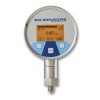 One option would be a pressure gauge type logger such as the DM01, where you can see the pressure on the LCD screen and download the logged data via the USB.
 The other option is a blind device but specifically designed for the water industry called the Triton, this will connect to the water line and data log to a set regime, and you can download the data to a laptop or PC via an infrared adaptor. The logging and analysis of the data is very comprehensive with the Triton, since it was specifically designed for the task of logging water mains pressure.
Sprinkler system water pressure recorder
What could we use to record water pressures on a sprinkler system with which I could download the data?
The Triton water pressure recorder is designed to be used in wet environments for monitoring water pressures in pipes.
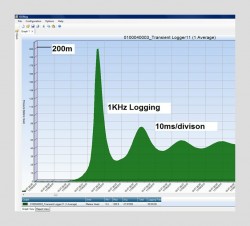
Record pressure with msec refresh rate
I am looking for a data logger that can read and record changes in pressure with millisecond refresh rates?
We would suggest the Triton transient logger for your application to meet your technical requirements. This product is widely used for detecting pressure spikes and pulses in systems and has a unique method of capturing the data in different log files for different regimes.
